

- A variety of formats, such as line, bar, and circle graphs
- Including histograms, pictographs, and infographics
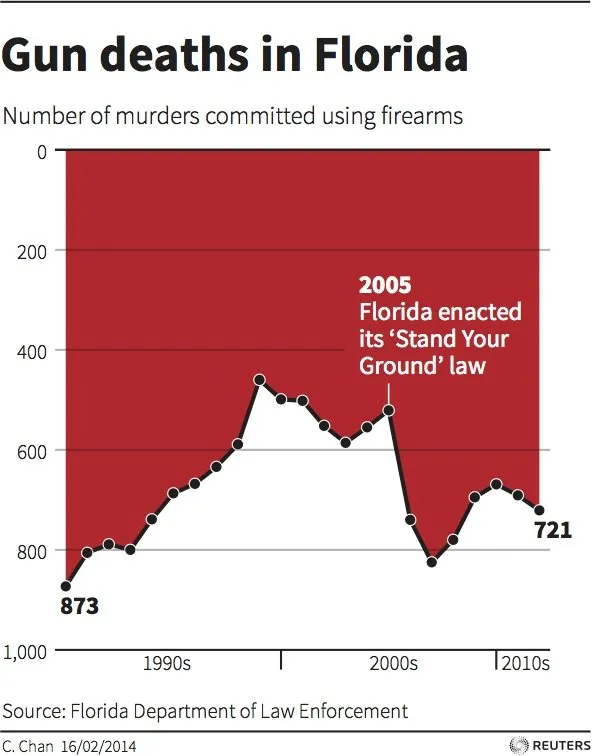
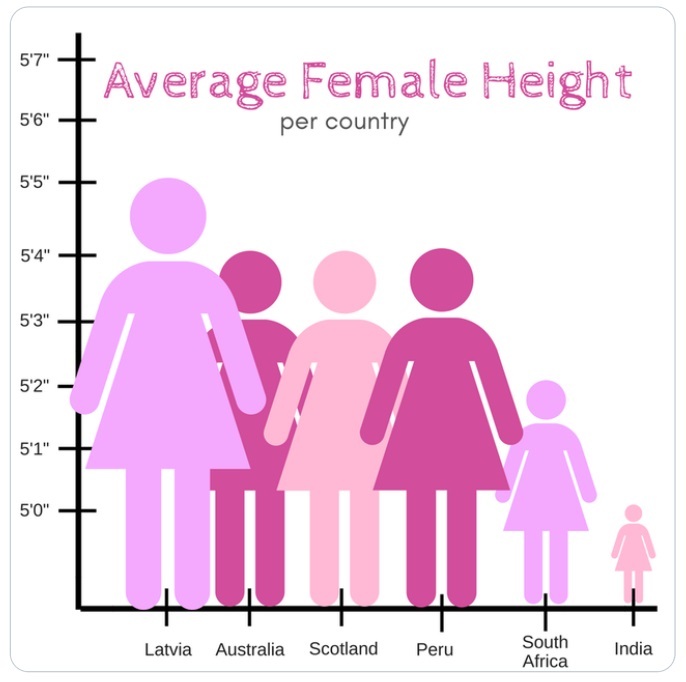
What is misleading about each of the following graphs? How could the graph be fixed?
Top Six Countries by Military Expenditures
Ticket Prices for Baseball and Basketball Games
Average Female Height by Country
Climate change deniers like to post misleading graphs, because the science is strongly against their position. Note that the links to NOAA in the US are now dead, as their government officially does not believe in climate change. Also note the wildly implausible $178 trillion figure.
Funny Graphs
Thomson Reuters: Unintentional Venn Diagram
Worksheets